"When will it be done?" has an honest answer. It's a range.
No estimates. No story points. Honest Cheetah reads how fast your team has actually been finishing things and runs the numbers ten thousand times.
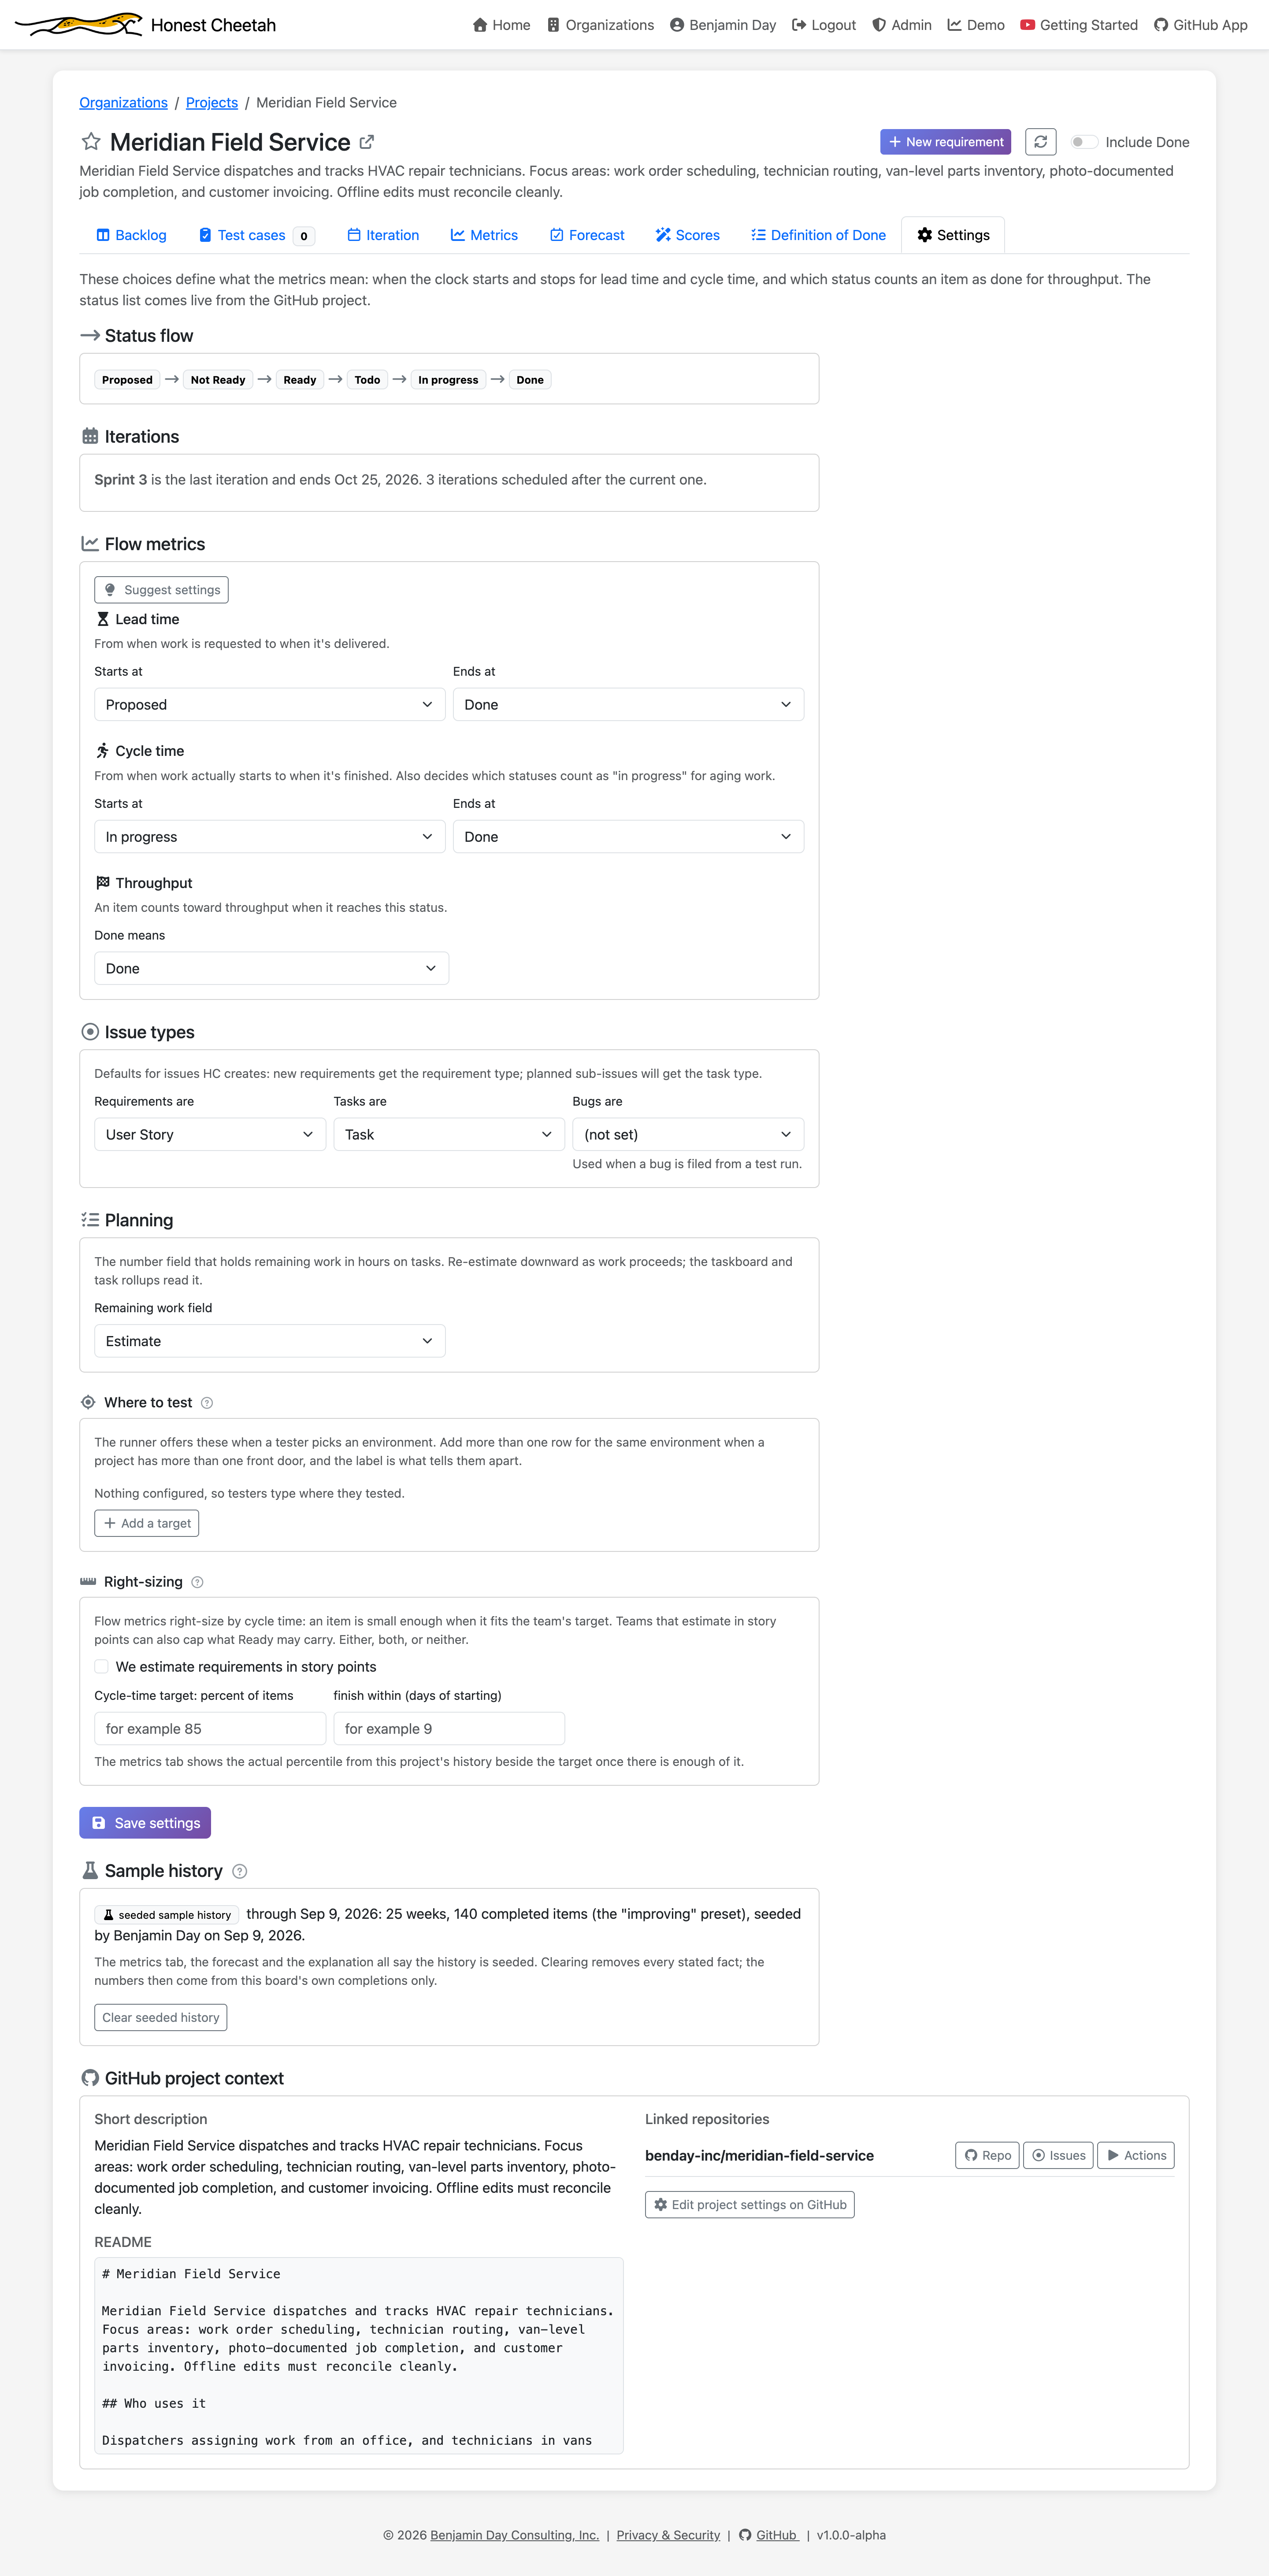
You tell HC which statuses mean "started" and "finished." It computes the rest from your board's own status history. Counts, not percentages. The model never touches the arithmetic.
Metrics
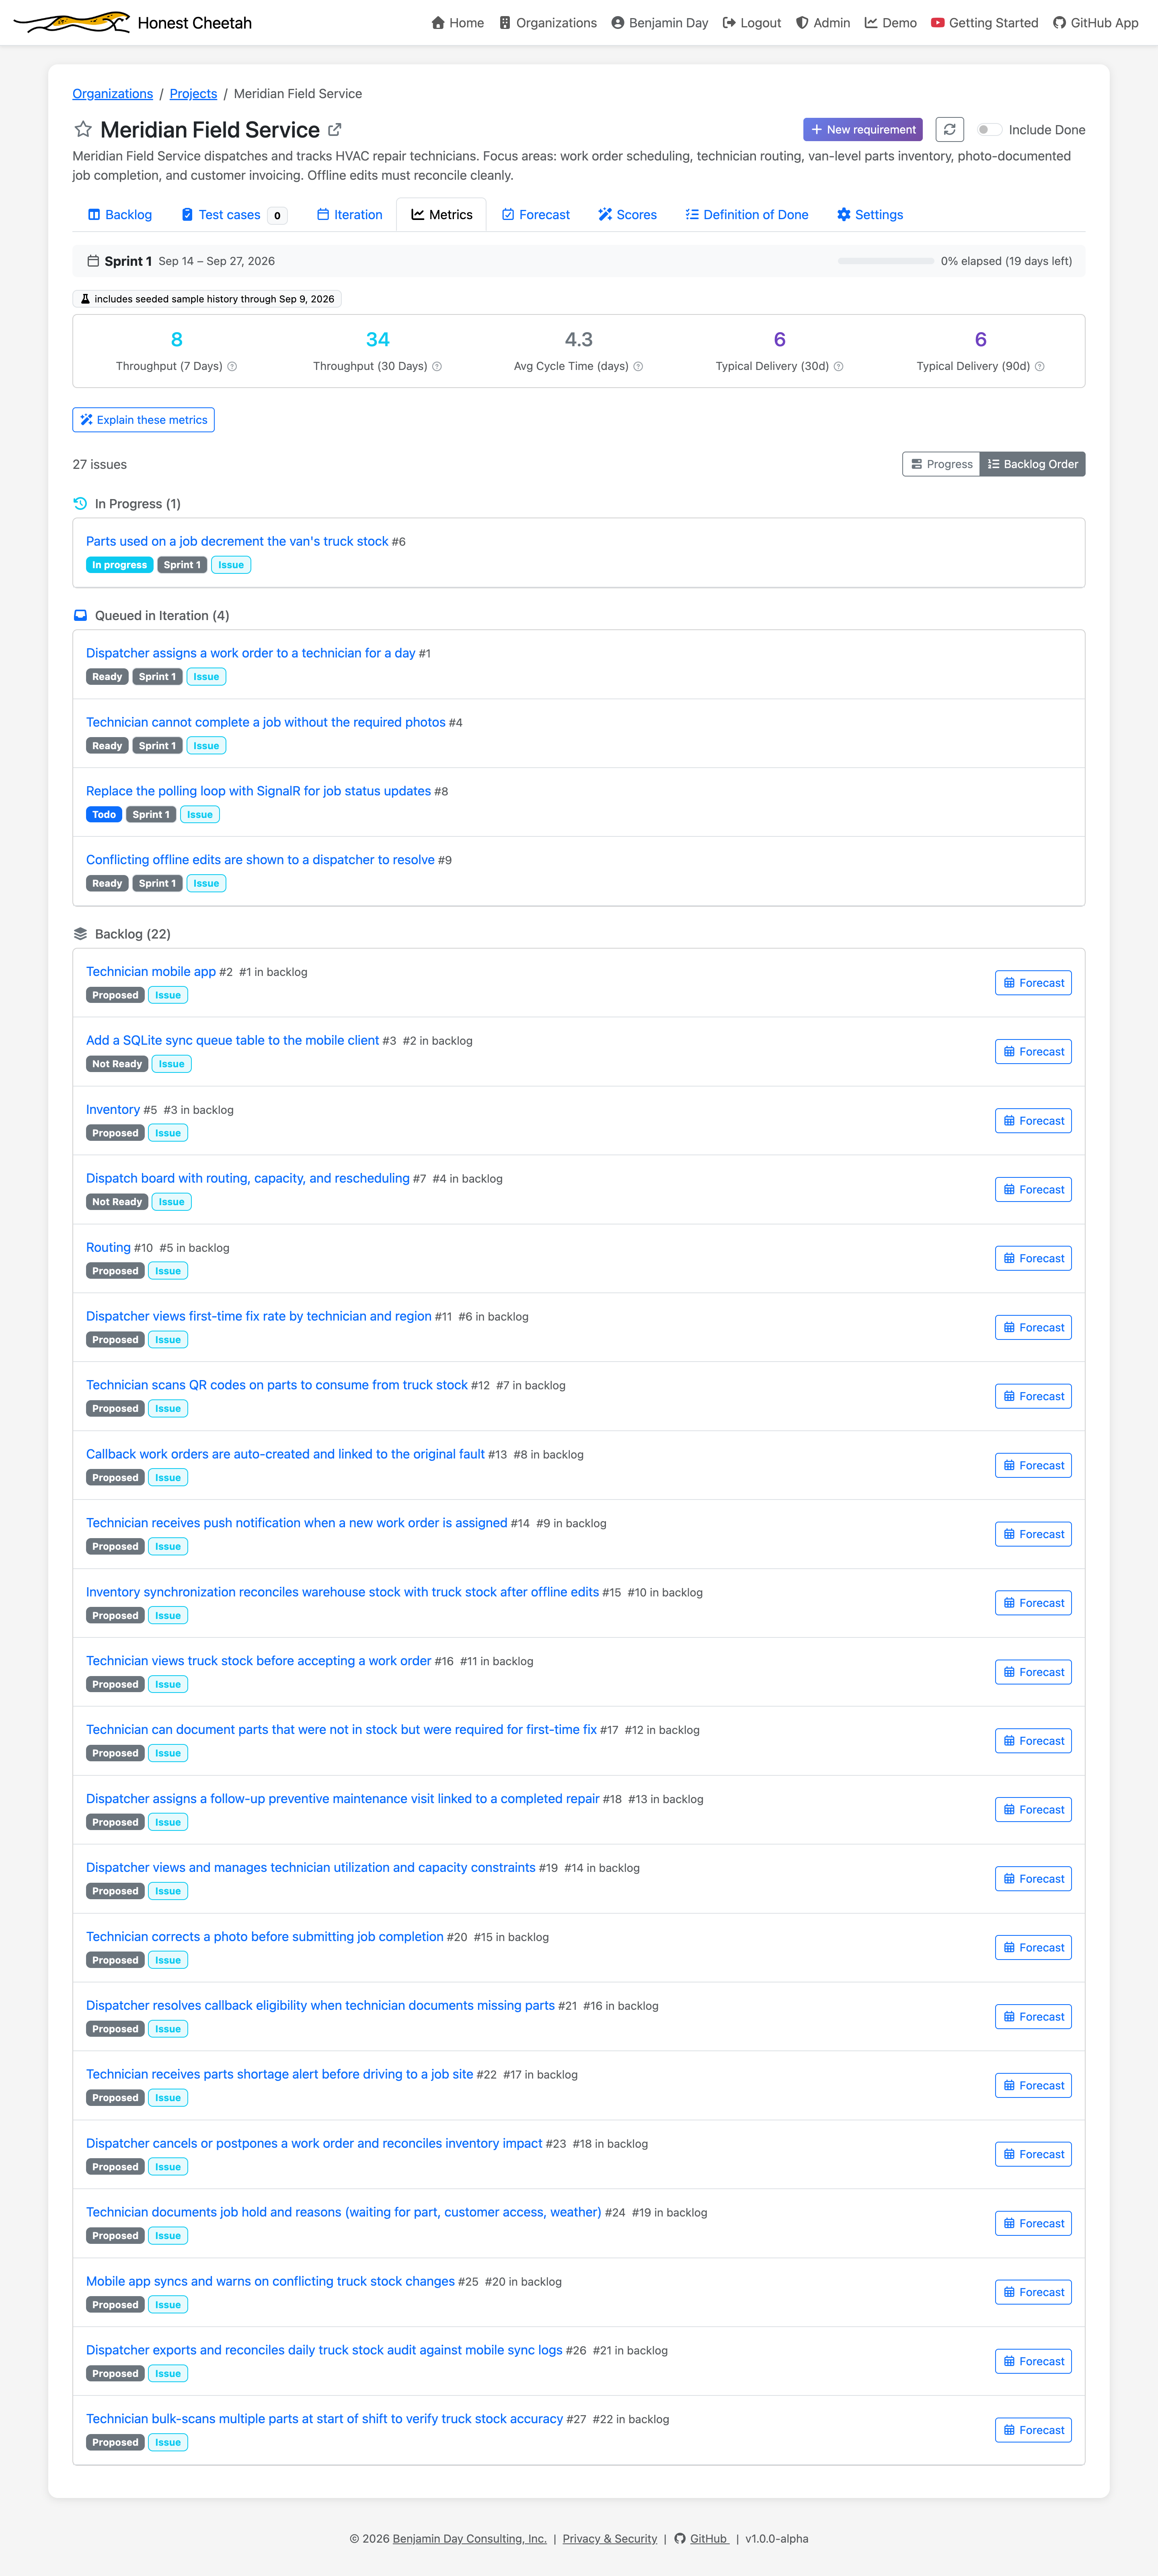
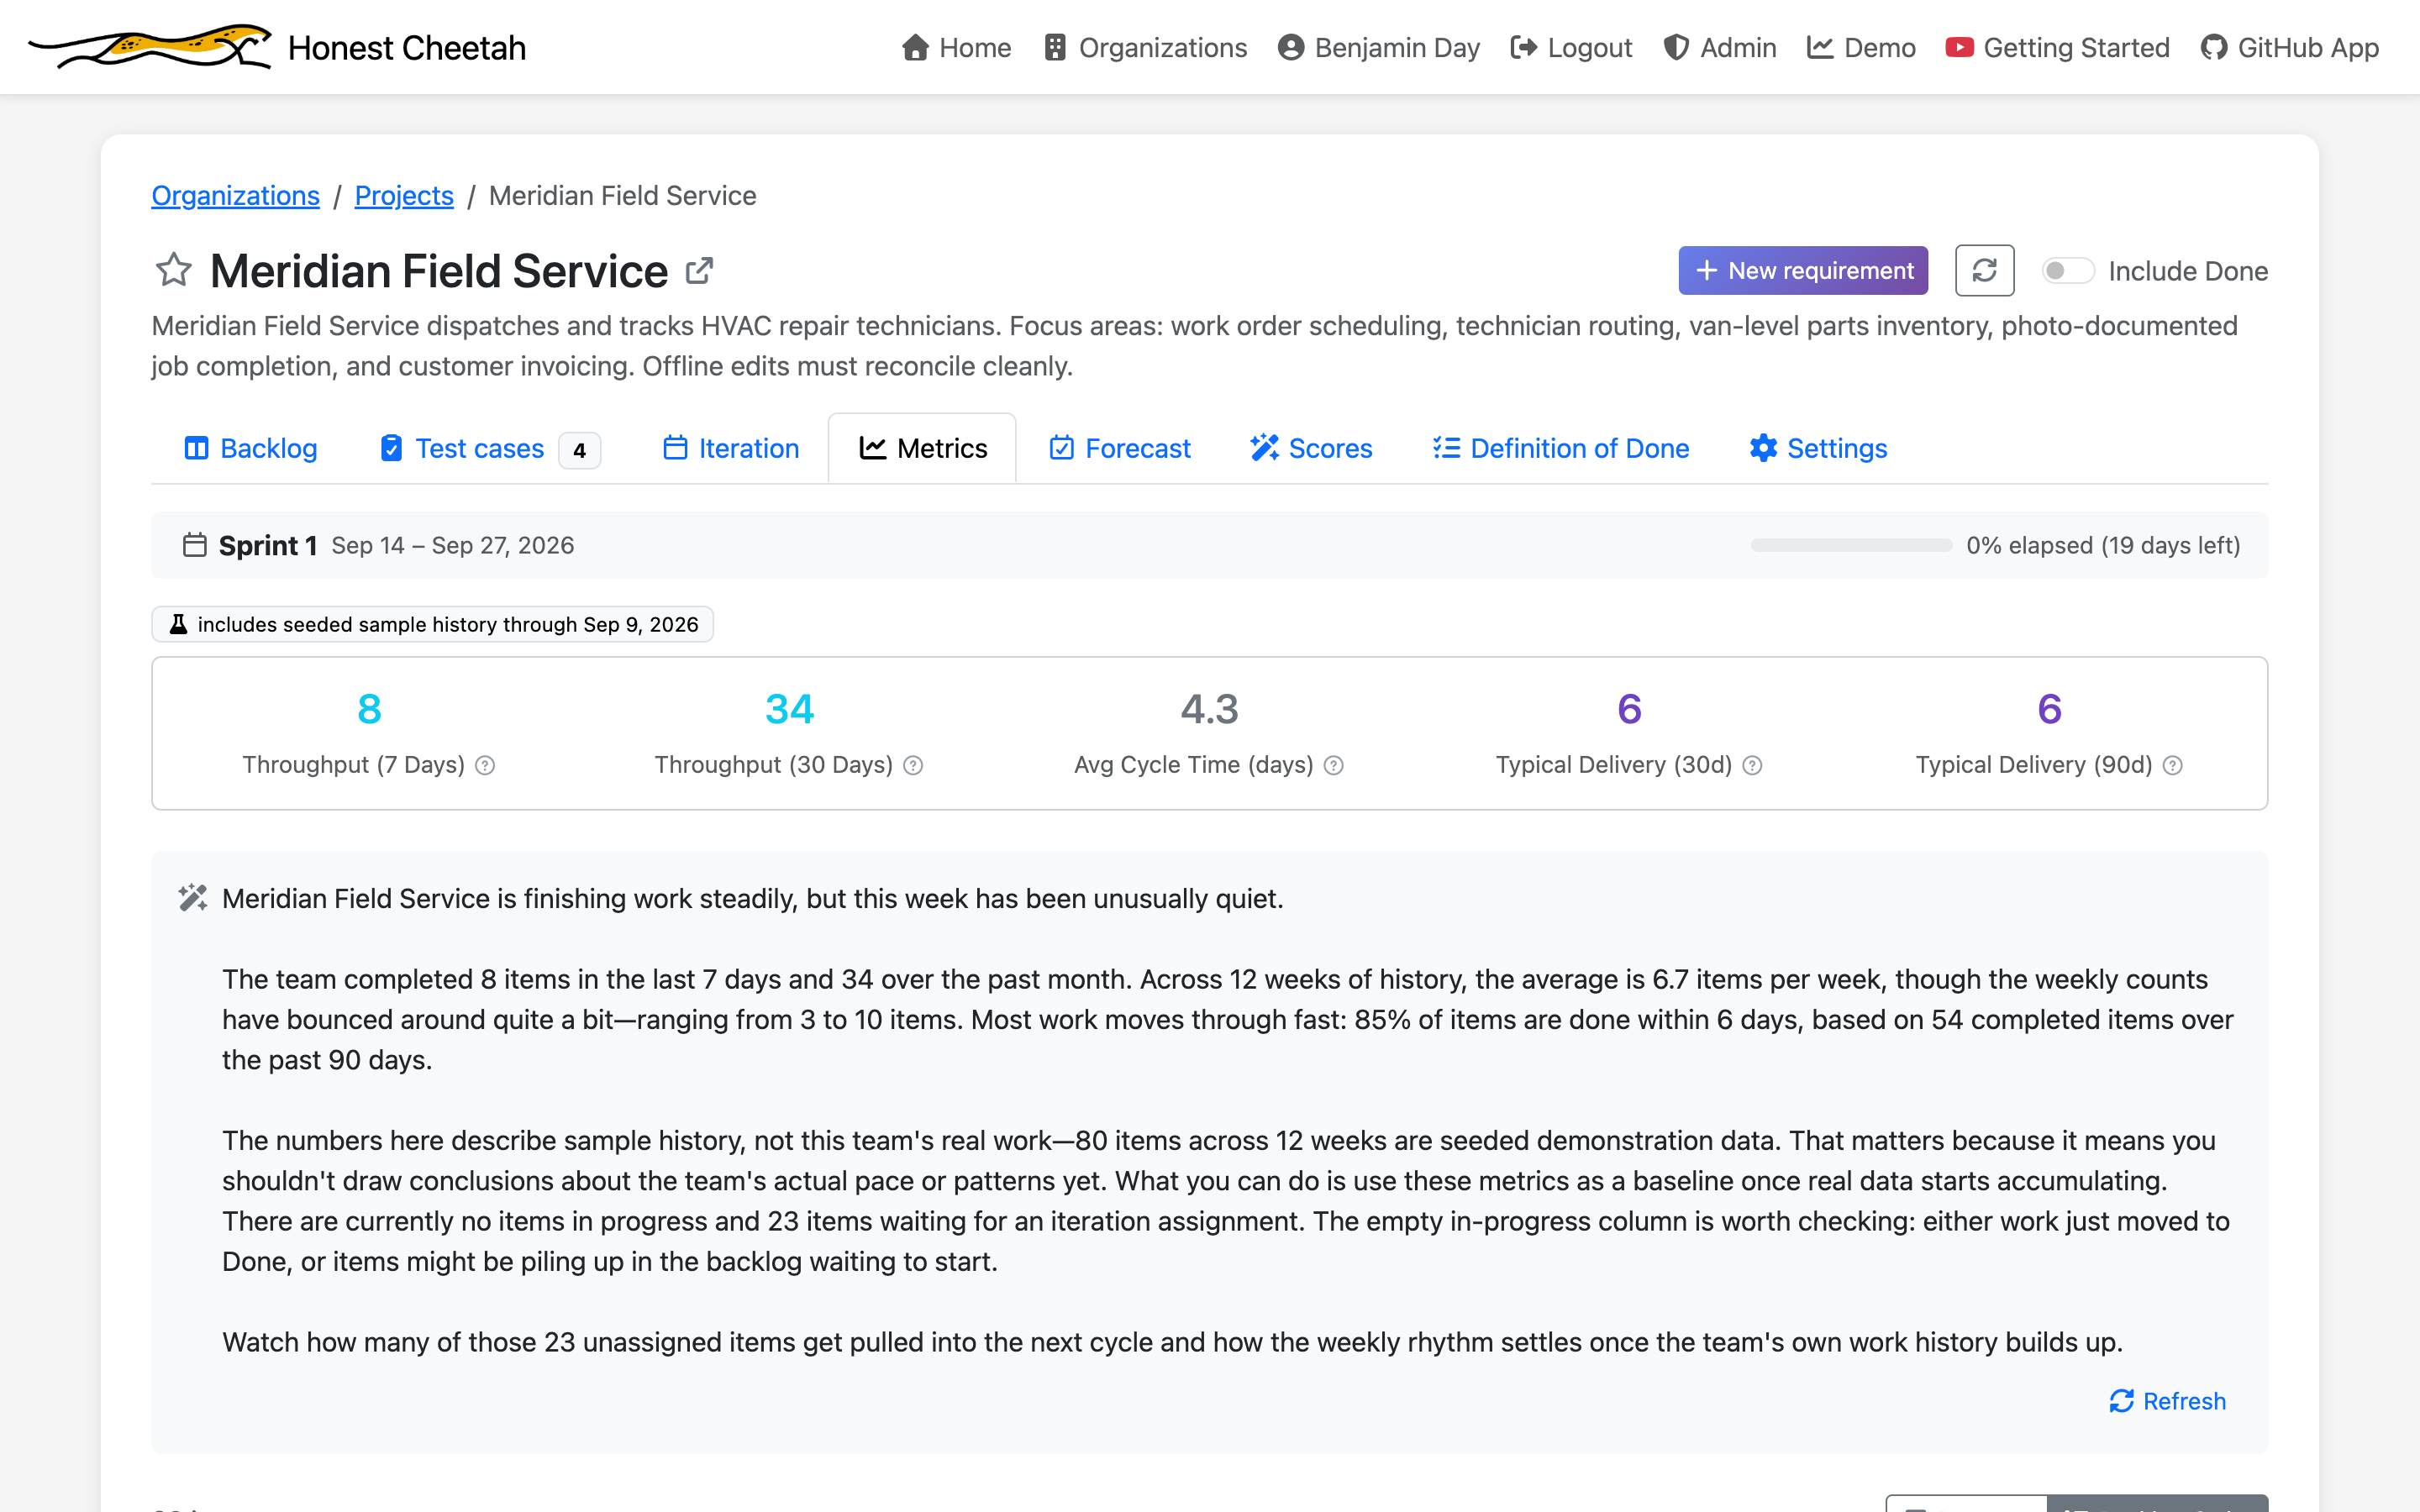
The Metrics tab shows throughput over the last 7 and 30 days, average cycle time, and typical delivery time, then a week-by-week table and the progress of every item on the board. Weeks that came from seeded history wear a badge that says so.
Two questions, two forecasts
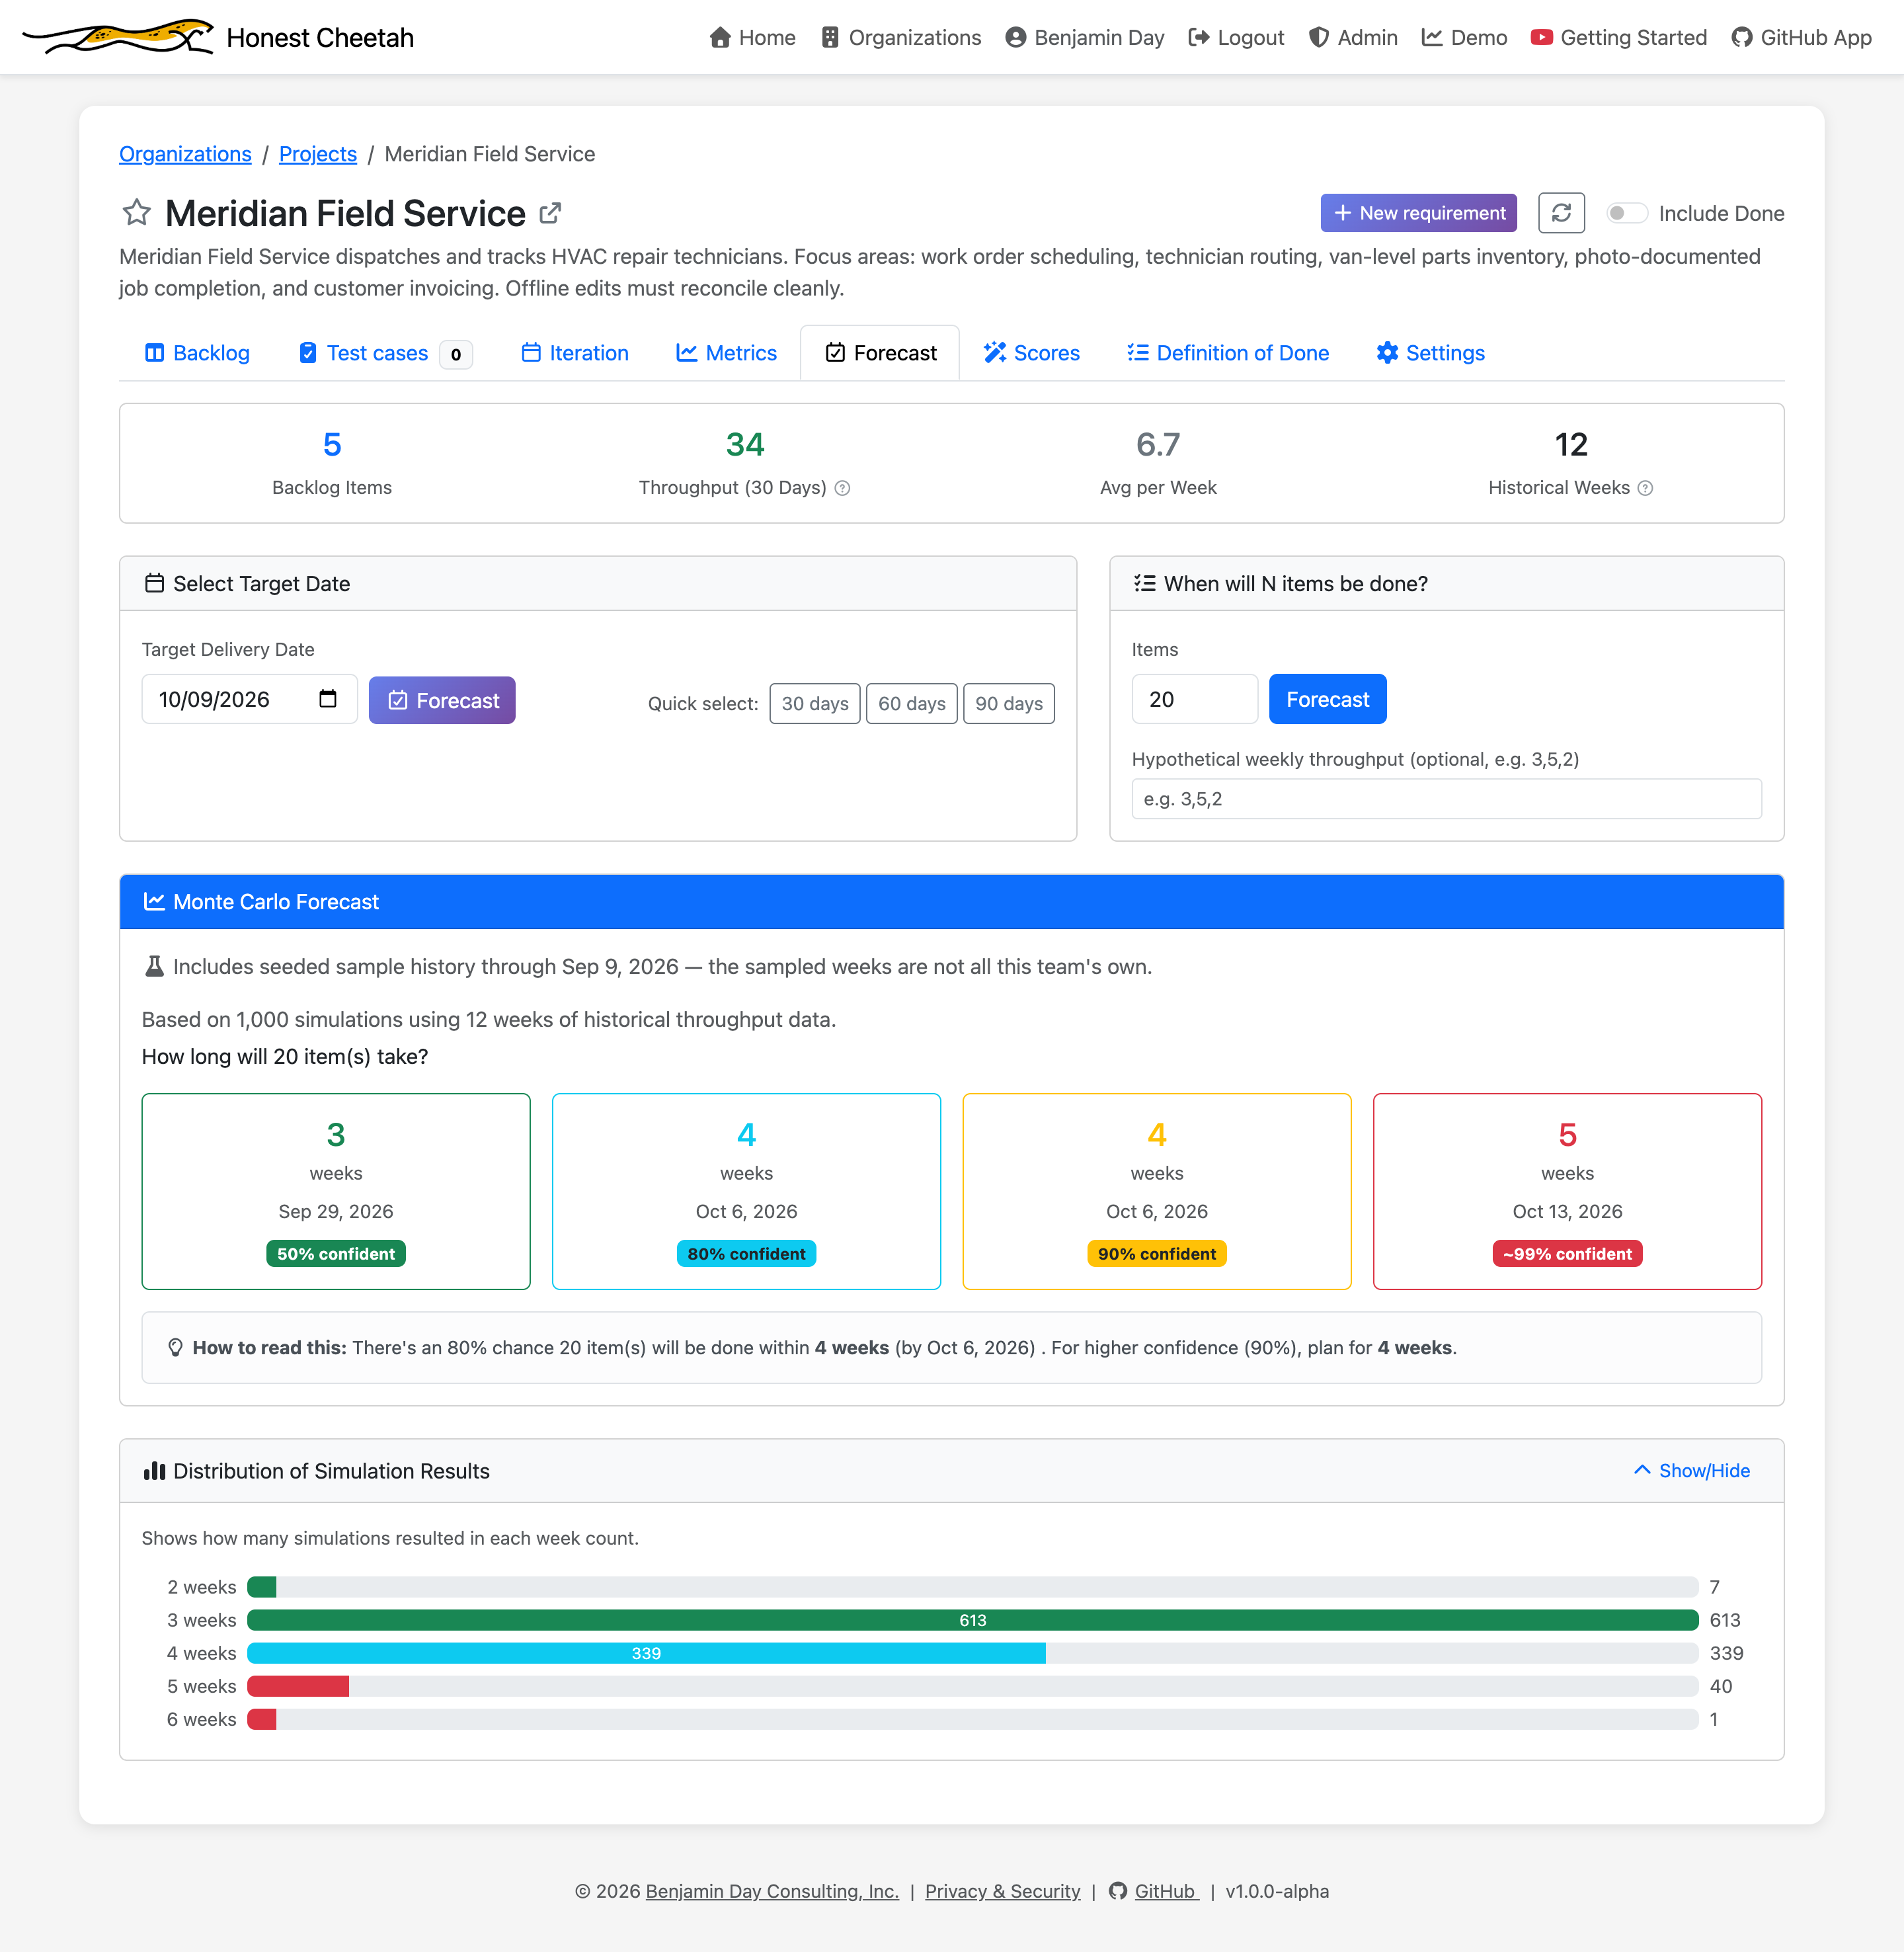
How long will N items take?
Give it a count. Get a date at 50%, 80%, 90%, and 99% confidence, and the distribution of simulated outcomes by week.
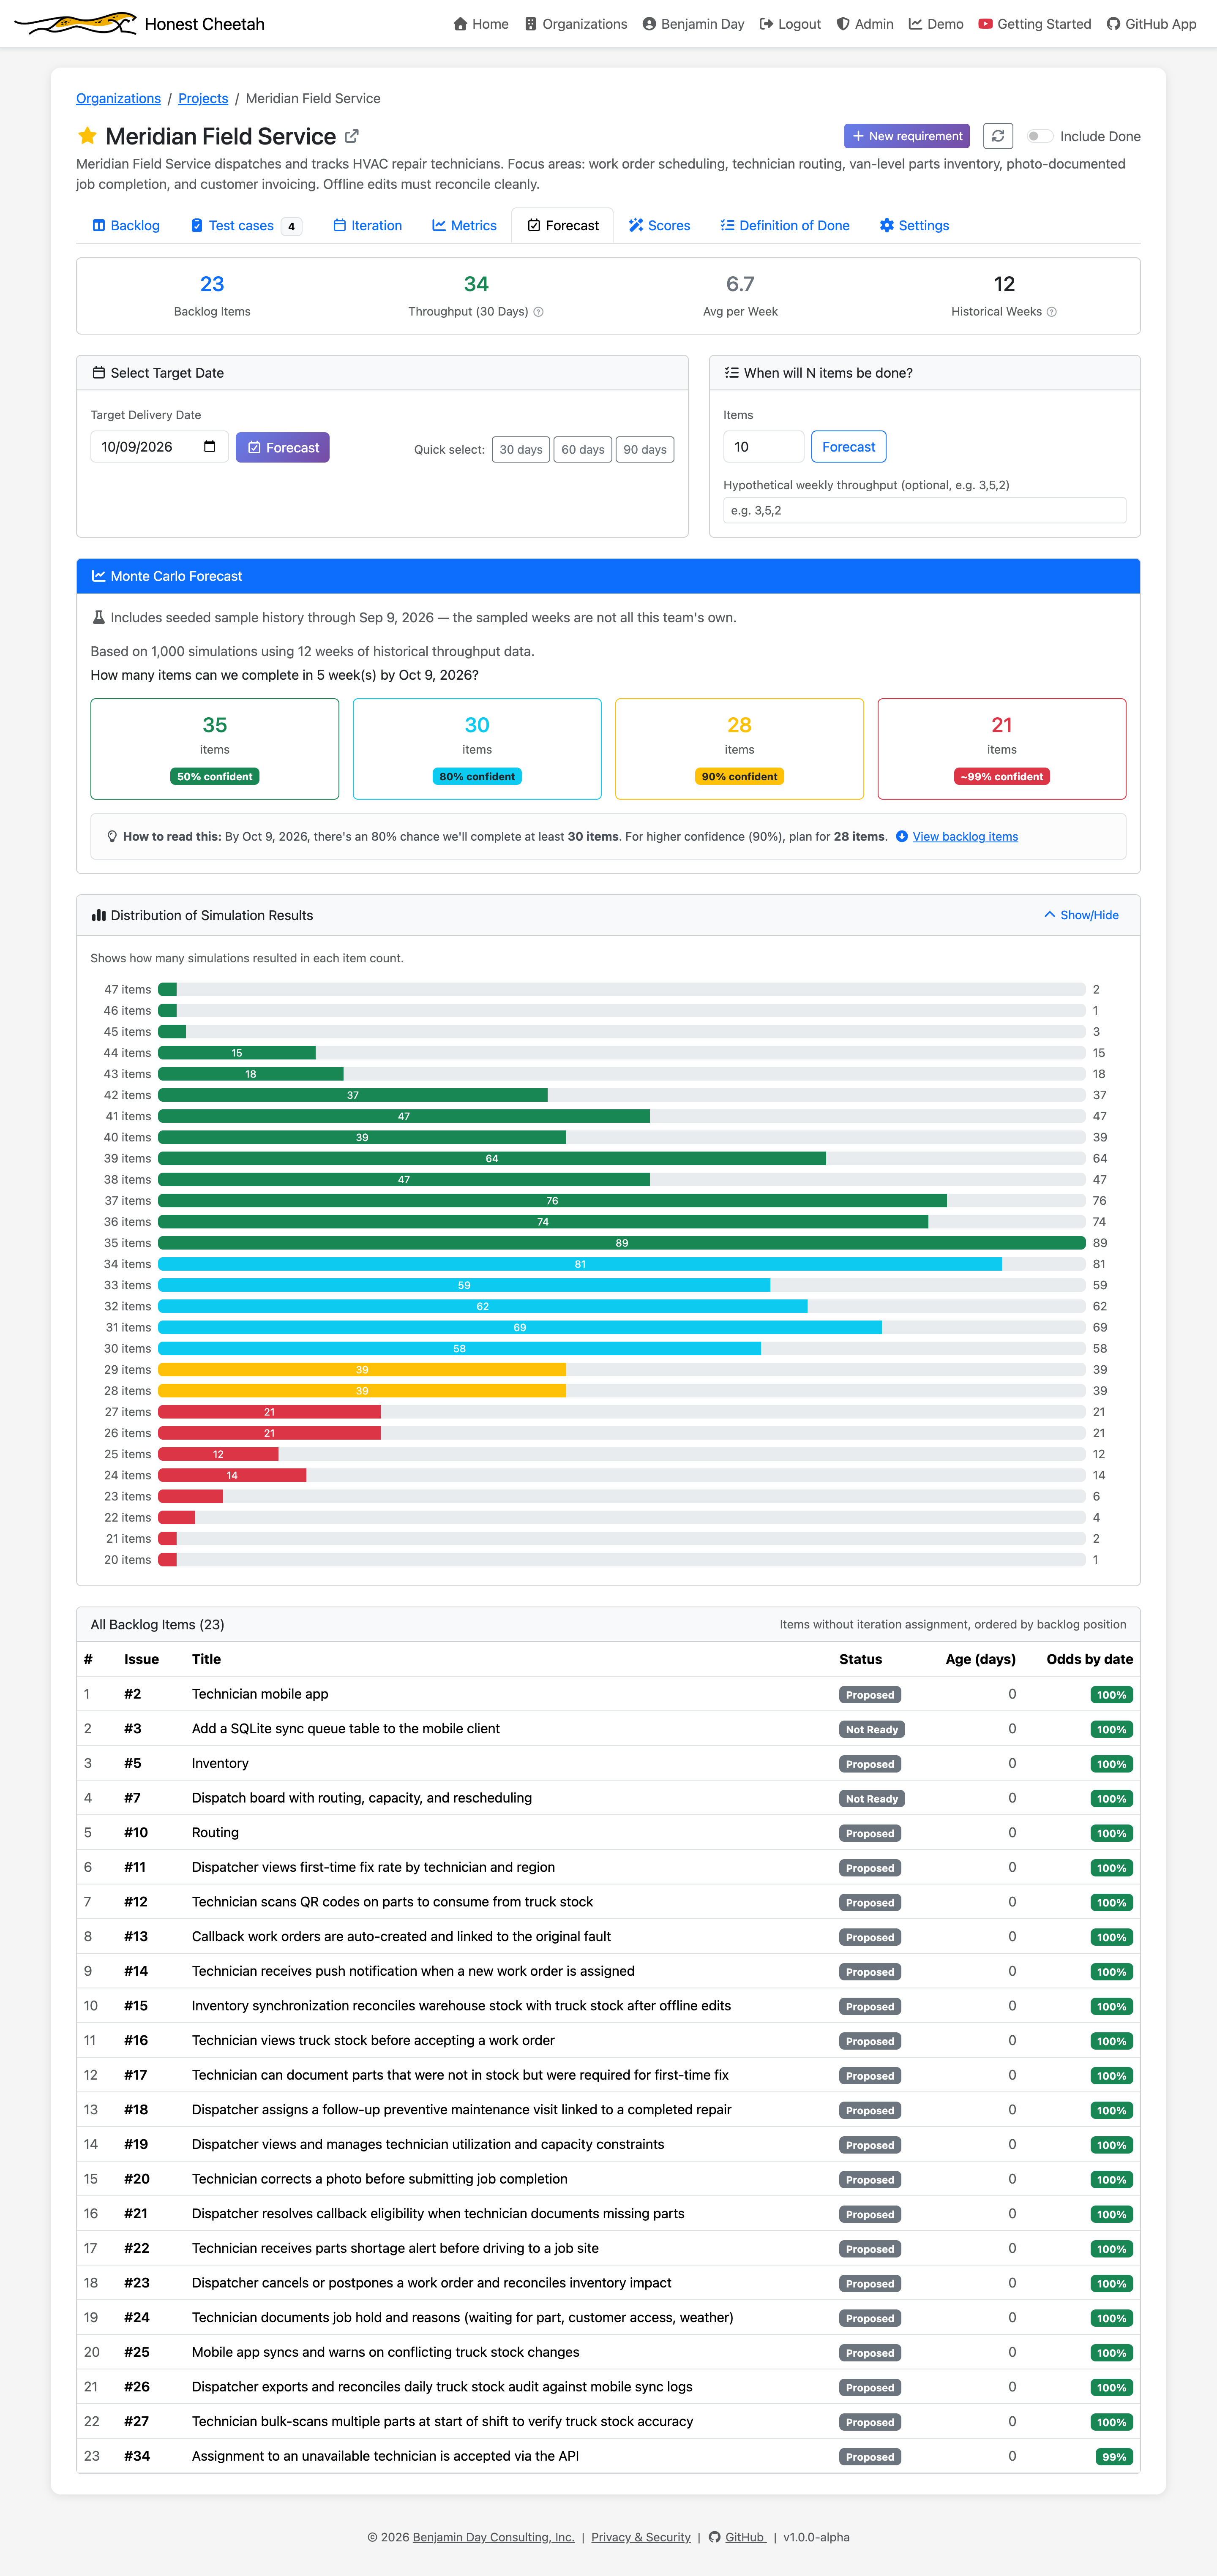
How many items by this date?
Give it a date. Get a count at each confidence level — and, under it, the backlog in order with each item's odds of making it.
For the per-item version of "when?" — a sprint next to every requirement on the backlog — see the Likely iteration column. You can also try a hypothetical throughput to see what "if we were a little faster" actually buys you.
Explained in plain English
Click Explain and the AI narrates what the numbers mean — what's trending, what's stuck, what to watch. It reads the metrics HC already computed. It doesn't compute anything itself, and if part of the history is seeded, the narrative says so.
Nothing to forecast yet?
A new board has no history, and a forecast with no history is a shrug. Settings lets you seed sample history — three presets, one click — so you can see how the metrics and forecasts behave before your own history exists. Seeded weeks are labelled seeded on the metrics page, in the assumptions line, and in the AI's narrative. Clear it whenever you like.